2018 Customer Satisfaction Results
It’s the time of year for reflection, and also for forward planning. As part of this process, we’re looking at our successes and what we could do better. We’re reviewing plans for Brexit, and ensuring we have the optimum processes in place for GDPR.
We regularly review our performance and procedures in line with our ISO certifications. Thank you if you completed our Customer Satisfaction Survey earlier in the year!
Satisfied customers
We are pleased to report that this year’s survey detailed excellent feedback. This is a reflection of the hard work of the whole kpm team; with survey results highlighting that;
- 83% of respondents rated our product quality high, indicating it’s ‘much better’ or ‘somewhat better’ compared to competitors
- 95% of respondents rated our responsiveness highly, indicating that we are ‘extremely’ or ‘very’ responsive
- Over 70% of respondents answered ‘extremely well’ when asked to rate how our team answer your questions
- 87% of respondents stated that they are ‘very happy’ with production times, indicating that we ‘exceed requirements’
- 87% of respondents answered ‘very satisfied’ when asked how well the customer service team understand your requirements and offer you the correct production solution
Our customers would recommend us
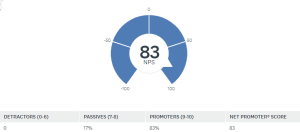
In addition, we are thrilled to report a Net Promoter Score of 83, our highest yet! This means that when asked ‘How likely is it that you would recommend kpm to a friend or colleague?’ 83% of respondents rated it very likely (9 or 10) that they would recommend us. This translates into a high NPS score, which we are keen to maintain.
For reference, some example b2b and consumer NPS scores are below. Many are large brands with global reach, where leaders are likely to enjoy high customer retention.
Print industry = 75
B2B service providers = 69
Consumer brands with leading NPS scores:
- First Direct = 73
- Nationwide Building Society = 43
- John Lewis = 42
- Marks and Spencer = 31
- Apple = 28
In our industry, we are happy that these results highlight customer ease of use, access to support, value for money and the customer experience. We aim to maintain and improve these results and look forward to working with you in 2019.